Flights
Flights

Flights

💡
Forecast arrivals to make the most strategic decisions and take advantage of the most up-to-date and reliable data on flight searches and bookings.

Get a complete overview of your visitors’ profile data:  origin, purpose, length of stay, booking window, and itinerary. Identify travel trends and predict when and where to target your resources to maximise the ROI.

🆕 We have improved our flight module, offering two distinct datasets pre-filtered by searches and bookings.

Each is split by search/booking day (when passengers have searched for or booked their flight) and travel day (when passengers intend to fly or will fly).

The main advantages of this time division:

  • Per day of the search/booking can, for example, help you, together with local stakeholders, to plan and design targeted marketing campaigns;
  • Per day of travel, they are essential for planning events or creating new experiences and specific travel products.
image

‼️ With this latest update, we introduce the concept of "rolling views," a feature that allows comparing current data variations against those of the same period in the previous year.

This approach is beneficial when dealing with provisional data, such as future projections. In such instances, comparisons will be made using the provisional data from the previous year, enabling an accurate assessment of trends, for example, in bookings on the same date of the last year. This provides a clear and consistent picture of how things are evolving.

image

🆕 Flight Searches

💡
A game-changing new section in the Flights module!

Now, you can benefit from a new section focusing on flight searches, and for you to fully leverage it, we split them into two main pre-filtered data sets: by the day of the search, when passengers looked for their flight, and by travel day, when passengers plan to fly.

image
The key benefits of these new data
  • Flight search by the day of the search will, for instance, help you and the local stakeholders plan and design targeted marketing campaigns;
  • Flight search data by travel day is essential to schedule events or plan and create new specific travel experiences.

Each data set, always comparable with the same period the previous year, provides extensive information regarding flight searches conducted through GDS:  their overall number, an arrival forecast analysis with details regarding the search window, the average length of stay per origin country of passengers, the most searched routes and even a focus on the competing alternative destinations that passengers are checking flights for, filtered by arrival country and city.

Widgets in the Searches section

“Top departure countries”

The "Top departure countries" widget shows the top origin countries of passengers searching for your destination for the selected period.

image

This is essential data regarding market analysis for the potential development of specific products or the activation of targeted marketing campaigns.

“Insights into the countries of departure”

The "Insights into the countries of departure" widget provides a search behaviour analysis by country of origin for the selected period.

image

A helpful focus on specific data to best set up your marketing and management strategy, especially if you deepen the analysis also checking the data in the Destination and OTA Focus modules.

This is essential data regarding market analysis for the potential development of specific products or the activation of targeted marketing campaigns.

"Most Searched Travel Routes"

This widget gives you a complete overview of the main routes connecting your destination. Whether you are a tourism professional, a local administrator or a marketing expert, this feature will help you better understand the travel dynamics of your visitors and take advantage of this valuable information.

image

Through the "Most Searched Travel Routes" widget, you can access accurate and up-to-date data on the distribution of departure airports of travellers heading to your destination. This will allow you to identify the most critical source markets and understand which cities are the primary sources of incoming tourists. You will be able to analyse and visualise seasonal or annual trends, allowing you to adapt your marketing strategy based on variations in the tourist flow.

"Length of Stay"

The "Length of Stay" widget helps you better understand traveller behaviour and identify potential growth opportunities.

image

Using this widget, you can obtain valuable data regarding travellers' average length of stay from different source markets. This information is essential for marketing strategies and for optimising tourism resources. You can identify which countries contribute the most to your destination's overall length of stay, allowing you to adopt targeted tactics to best attract and satisfy tourists in those markets.

"One Way vs. Round Trip"

The "One Way vs. Round Trip" widget allows you to obtain a detailed overview of the distribution of travel types among visitors. Thanks to this widget, you will be able to understand the travel preferences of your users better and obtain crucial information for the strategic planning of the tourism sector of your city or region.

“Top competing destinations per arrival country and city”

This widget compares your destination with those identified as possible competitors, analysing the volume of searches, the booking window and the average length of stay.

image

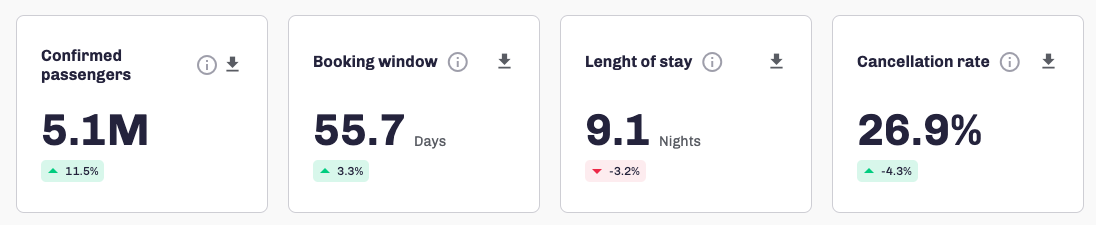
Widgets in the Bookings section

image
How does the "Confirmed Passengers" widget work?

The "Confirmed Passengers" widget aims to provide users with a detailed analysis of the breakdown of passengers based on the number of people per booking to help tour operators and destination managers better understand tourists' travel habits.

The operation of the widget is intuitive and efficient. The data is processed and displayed clearly and understandably after selecting the destination country or the market of interest. The device identifies the booking categories based on the number of passengers and presents them as graphs.

Main advantages:

Optimised Trip Value: by breaking down passengers by booking, tour operators and authorities can identify the types of travellers who tend to travel together. This allows them to optimise the offer and improve promotions to attract larger groups or better adapt to the needs of solo travellers.

Customisation of Offering: with a detailed understanding of the average number of passengers per booking, travel offerings can be tailored to meet the needs of various customer segments better. For example, offering special packages or dedicated discounts might be interesting if there are trends in large group bookings.

Strategic Planning: this widget provides valuable information for strategically planning tourism infrastructure and services. Knowing how many passengers typically book simultaneously is helpful in properly sizing accommodations, transportation, and other essential facilities.

Promotion Targeting: with a greater understanding of traveller preferences around group size, you can create targeted marketing campaigns that better resonate with your desired audience. This can lead to greater user engagement and, consequently, an increase in bookings.

“Top departure countries”

The "Top departure countries" widget shows the top origin countries of passengers searching for your destination for the selected period.

image

This is essential data regarding market analysis for the potential development of specific products or the activation of targeted marketing campaigns.

“Insights into the countries of departure”

A helpful focus on specific data to best set up your marketing and management strategy in a given period.

This is an essential piece of data in terms of market analysis, given the potential development of specific products or the activation of particular marketing campaigns.

image

“Distribution of Passengers Volume”
image

The widget is a tool designed to provide a detailed and in-depth overview of the bookings and cancellations of incoming travellers. This widget offers advanced features to help users understand travel patterns, booking trends, and source market fluctuations. How does it work: Parameter selection: Users can specify the desired analysis period, defining a time window for analysing reservations and cancellations. This can be useful for focusing on a specific time, such as holidays or special events, or examining seasonal trends. Reservations and Cancellations: The widget analyses real-time and historical data to extract crucial information regarding the number of reservations and cancellations registered during the selected period. This analysis makes it possible to identify variations in the flow of travellers and better understand booking dynamics. Passenger distribution: Through interactive graphs and charts, the widget displays the distribution of passengers from different regions or countries. This helps tour operators identify the most relevant tourism sources and tailor marketing strategies based on that information. The trend over time: a fundamental aspect of the widget is the possibility to examine the movement of reservations and cancellations over time. Users can view data daily, weekly or monthly, allowing them to spot any seasonal trends or fluctuations. Cancellation analysis: This widget also offers a detailed analysis of cancellations, detecting any patterns or correlations between the increase in cancellations and specific events or situations. Widget utility: This widget analyses the volume trends of passengers, confirmed and cancelled, for the selected period—essential data for anyone managing or promoting a tourist destination. The information obtained from this tool allows you to make informed strategic decisions, such as optimising marketing campaigns based on the regions of most significant interest or adapting the tourist offer according to peak booking periods.

How does the "Most Booked Travel Routes" widget work?

This widget gives you a complete overview of the main routes connecting your destination. Whether you are a tourism professional, a local administrator or a marketing expert, this feature will help you better understand the travel dynamics of your visitors and take advantage of this valuable information.

Through the "Most Booked Travel Routes" widget, you can access accurate and up-to-date data on the distribution of departure airports of travellers heading to your destination. This will allow you to identify the most critical source markets and understand which cities are the primary sources of incoming tourists. You will be able to analyse and visualise seasonal or annual trends, allowing you to adapt your marketing strategy based on variations in the tourist flow.

In addition, the widget will provide you with a list of "top departure cities", i.e. those locations from which the most significant number of travellers to your destination depart. This information is beneficial for developing targeted and personalised local marketing campaigns for each city to attract an even broader and more differentiated audience.

The widget's simple interface makes data analysis intuitive and straightforward. You can view the results in graphs, tables or interactive maps, making reading and interpreting the data a pleasant experience. Furthermore, you can filter the data by specific periods or other variables, providing a personalised and detailed view of the main routes.

image
How does the "One Way vs. Round Trip" widget work?

The "One Way vs. Round Trip" widget allows you to obtain a detailed overview of the distribution of travel types among visitors. Thanks to this widget, you will be able to understand the travel preferences of your users better and obtain crucial information for the strategic planning of the tourism sector of your city or region.

The heart of this widget is based on collecting and analysing data relating to passenger reservations for airline flights. The device uses intelligent algorithms to identify and distinguish between "one-way" and "return" bookings.

With the intuitive use of the widget, users can easily select a particular period or a specific interval, and the generated graph will show the percentage of passengers who have opted for a one-way flight compared to those who have chosen a round trip. Furthermore, you can reach preferences among visitors from different locations, providing a more in-depth analysis of the travel type distribution.

Using this widget offers several valuable benefits for your travel business. For example, you will be able to understand whether your destination is more attractive for one-way tourists or for those who prefer to make return trips, allowing you to adapt your offer of services and promotions accordingly.

Plus, with access to real-time data and frequent updates, this tool will help you monitor trend changes in traveller behaviour over time. You might find, for example, that a specific group of visitors are gradually turning to one-way travel, allowing you to identify new market opportunities and develop strategies to appeal to different audiences.

Finally, the widget integrates perfectly with the other analysis tools of the platform, providing a complete and synergistic view of your destination's tourism data. You can combine the information obtained with other metrics, such as foot traffic, hotel reservations and more, to understand the behaviour of tourists and residents.

How does the "Cabin Class" widget work?

The "Cabin Class" widget is designed to provide an in-depth overview of the type of travellers who have made reservations by analysing the distribution of selected travel classes. It is a crucial display option that can provide valuable information regarding passenger preferences during the booking process. It allows you to categorise the reservations made by travellers in different travel classes, such as Economy, Business or First Class, offering a complete picture of the choices' distribution.

The information provided by the widget will allow you to understand your customers' preferences better and help you make informed decisions to optimise the travel and service offer. For example, most travellers choose Economy class, suggesting you focus your promotions and discounts on this category to attract more customers.

Furthermore, using the data provided by this widget, you can evaluate the success of any marketing campaigns aimed at specific travel classes and make strategic changes to improve your users' satisfaction and increase bookings in less frequented travel classes.

How does the "Length of Stay" widget work?

The "Length of Stay" widget helps you better understand traveller behaviour and identify potential growth opportunities.

Using this widget, you can obtain valuable data regarding travellers' average length of stay from different source markets. This information is essential for marketing strategies and for optimising tourism resources. You can identify which countries contribute the most to your destination's overall length of stay, allowing you to adopt targeted tactics to best attract and satisfy tourists in those markets. In addition, with the "Length of Stay" widget, you can classify travellers into different types, allowing you to understand other travel behaviours better. This could be useful for adapting the tourist offer according to the preferences of the various customer segments, creating tailor-made experiences best to meet the needs of each group of travellers.

image
What data are shown in the “Top competing destinations per arrival country and city” widget?

This widget compares your destination with those identified as possible competitors, analysing the volume of searches, the booking window and the average length of stay.

General FAQs

What are the data sources of the flights section?

In the Flights section of our data analysis platform for tourist destinations, the data sources come from trusted and established sources known as GDS, i.e. Global Distribution Systems. These GDSs constitute a global network of computer systems used by airlines and travel agents to manage, book and sell flights, not only domestic but also international.

Connecting to GDS gives our destination managers real-time information about itineraries, bookings, flight durations and other crucial information. Thanks to this direct connection with the GDSs, we can guarantee highly accurate and up-to-date data, providing our platform with a reliable and complete experience.

Using GDS as a data source for the Flights section allows us to offer a detailed and comprehensive overview of the flight options available to their travel destination. This level of detail is essential for making informed decisions regarding route optimisation, demand forecasting, market trend analysis, and overall improvement of travel strategies.

Our platform uses advanced algorithms to aggregate and analyse data from GDSs, presenting it clearly and intuitively through our dedicated widgets. You can easily explore different flight options, identify high and low season periods, monitor booking trends and predict future demand.

Furthermore, thanks to the filtering and customisation features, they can adapt the information displayed to their needs. For example, you can set arrival airports, set specific search parameters and view only direct flights. This flexibility ensures a highly personalised and targeted experience for our users.

We are constantly striving to keep our data sources up to date, continually monitoring changes in the aviation industry and ensuring that the information provided is accurate and timely. We want to give a reliable platform to base strategic and tactical decisions to promote tourism in the destination.

What are GDSs?

GDSs (Global Distribution Systems) are technology platforms used in the travel and tourism industry to distribute and book travel services such as flights, hotels, car rentals, etc. GDSs act as intermediaries between travel service providers, such as airlines and hotel chains, and travel agents or online travel agencies.

GDSs collect and consolidate information about travel services from various sources, such as airlines, hotels and related service providers. This data is then made available to travel agents and OTAs, who can access the GDS via dedicated IT systems or web interfaces.

GDSs allow travel agents to access various travel options and make real-time bookings. Agents can compare fares, flight times, hotel availability and other relevant information through the GDS interface and book the required services on behalf of their clients. This allows travel agents to offer more choice and flexibility to their customers, as well as streamline the booking process.

Some of the major GDSs are Amadeus, Saber, Galileo and Travelport. These platforms are widely used in the travel industry and play a vital role in the global distribution of travel services. GDSs have become integral to the travel booking ecosystem, facilitating the connection between service providers and travel agents.

Does the information about flight searches and reservations consider all types of carriers, such as low-cost airlines?

Thanks to our exclusive partnership with Travelport, we can provide all data relating to leading international airlines, such as Air France, British Airways, and Lufthansa, thus returning a comprehensive picture of the current trends. At the moment, these data don't include low-cost carriers.

Which period can I analyse?

As for the period you can analyse, we have developed a highly flexible and versatile time filter. This allows you to conduct detailed analyses of the past and the future, opening new perspectives for making targeted and informed strategic decisions.

When we say past, we mean you can look into historical data. This is an essential feature for tracing performance trends and significant events over time. Find out how visitor flow has evolved over the seasons, identify peaks of interest in specific events or activities, and better understand the dynamics of your visitors over the years.

As for the future, our time filter allows you to go up to 12 months in the future concerning the day you are consulting the platform. Imagine having a privileged window into future trends, anticipated bookings and arriving passengers. This functionality is invaluable for planning promotional campaigns, predicting the demand for travel services and optimising marketing strategies. Not only can you analyse historical data, but you can also gain a valuable edge by looking beyond the horizon and leveraging intelligent forecasts to make decisions.

Our intuitive interface will guide you in using this powerful tool. Select your desired start and end date in our time filter, and the platform will automatically display relevant data for the selected period. You can easily change the analysis period to fit your evolving needs.

What filters can I use in the Flights section?

In the section dedicated to flights, we have made a wide range of filters available to obtain detailed and relevant analyses. These tools will allow you to explore and understand flight data effectively and efficiently.

Time Filter: The time filter allows you to specify the period of interest for flight analysis. You can select precise dates from a specific time range or even view historical data to identify trends and seasonality in flight trends to your tourist destination.

Filter by Airport: With the airport filter, you can focus on one or more relevant airports to your travel destination. This will allow you to monitor the progress of flights arriving and departing from specific airports, helping you better understand traveller preferences and adopt targeted marketing strategies.

image

Filter by Destination Country: You can examine flight trends to specific countries and identify growth markets or potential development opportunities.

Filter by Origin Market: This filter allows you to focus on travellers' departure airports. You will be able to identify the main cities or regions of origin of tourists who visit your destination, helping you to understand the leading market segments and create targeted promotional campaigns.

Filter by Flight Type: The flight type filter allows flight data analysis based on the type of air service, such as direct flights with stopovers. This can be useful for understanding which types of flights are the most popular and evaluating potential partnerships with airlines or tourist services.

Finally, we have introduced the COMPARE option, allowing you to compare several filters simultaneously. You can set custom combinations of filters to get in-depth analysis and detect correlations between variables. This advanced analysis tool will help you make informed and strategic decisions to improve the tourist attractiveness of your destination.

image

The Flights section of our analytics platform highlights the key insights Destination Managers need to optimise the travel industry and achieve success. With our highly customisable filters and the ability to compare different data, you can get a complete view of the flight landscape and act accordingly to improve the traveller experience and stimulate tourism in your destination.